FitBit Analysis

Data for this project simulated an individual’s activity tracked through Fitbit over a period of eight months. I determined the characteristics of the individual by looking at trends with time series analysis. To predict the next two weeks of data, I tested models on each column to determine the best results. Finals models were a weekly rolling average and Holt Optimized.
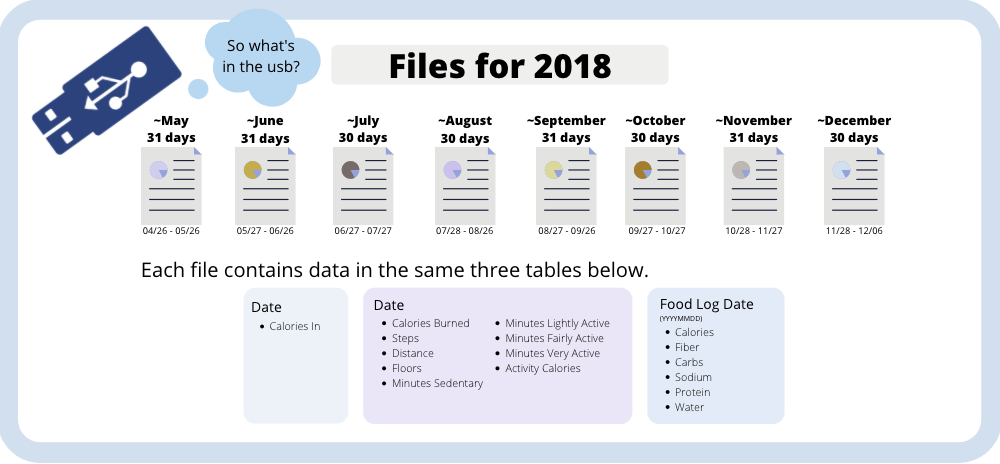
The files that contained the data were in eight seperate csv files, one for each month. A summary of these files is shown below.
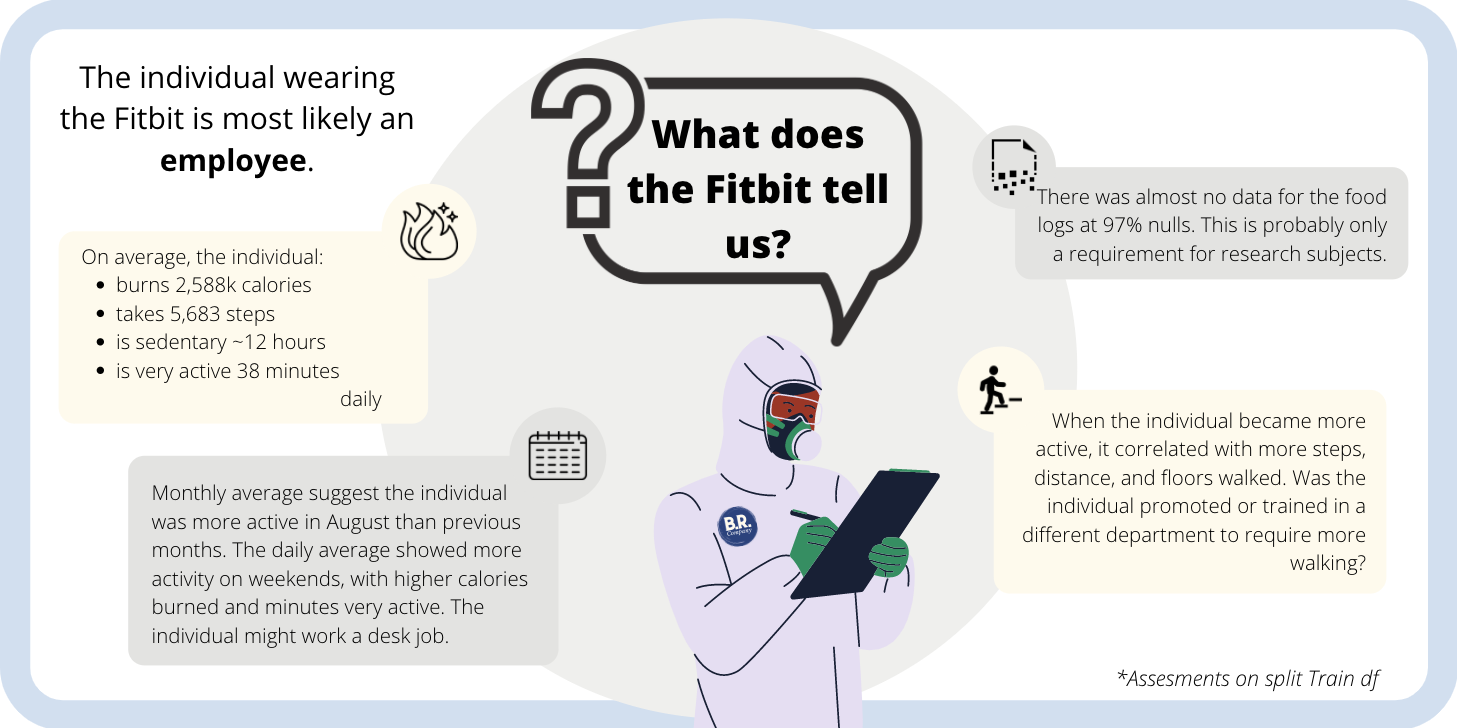
Final conclusions on the individual wearing the FitBit are shown below.